Volume Bubbles 📊 Volume Bubbles Pro — Visualize Candle Volumes as Elegant Bubbles
Tired of squinting at volume bars below your chart?
Introducing Volume Bubbles Pro — a sleek, intuitive indicator that displays each candle’s trading volume as transparent colored bubbles directly on your price chart. No more switching tabs — critical volume data is now right where you need it!
✨ Key Features:
🔹 Smart Volume Classification:
Each bubble’s size reflects the strength of volume:
→ Tiny — Below average
→ Normal — Above average
→ Large — Exceptionally high (fully customizable)
🔹 Flexible Bubble Placement:
Choose to display bubbles under, over, or centered on candles — tailor it to your workflow.
🔹 Two Color Schemes:
→ Single Color — Minimalist, clean look for distraction-free charts
→ Volume-Based Gradient — Tiny = Blue, Normal = Orange, Large = Red
🔹 Optional Info Panel:
Displays real-time thresholds for “medium” and “large” volume levels directly on your chart.
🔹 Interactive Tooltips:
Hover over any bubble to see exact volume value, average volume, and volume-to-average ratio.
🔹 Built-in Alerts:
Get notified instantly when a candle registers abnormally high volume — perfect for catching breakouts or reversals.
⚙️ Fully Customizable Settings:
Average Volume Period — baseline for comparison (default: 50)
Medium Volume Multiplier — threshold to classify volume as “medium”
Large Volume Multiplier — threshold to classify volume as “strong”
Transparency — adjust opacity so bubbles enhance, not clutter
Bubble Position — under, over, or centered on candles
Color Scheme — match your chart style or strategy needs
💡 How to Use It?
Spot Key Moments: Large red bubbles often signal breakout starts, reversals, or liquidity tests.
Confirm Signals: Strong volume under a candle validates signals from other indicators.
Filter Noise: Ignore tiny bubbles — low activity means low conviction.
Scan History: Instantly identify past high-volume events across any timeframe or asset.
✅ Why Traders Love It:
✔️ Clean, uncluttered visuals — only what matters
✔️ Works on all assets & timeframes — stocks, crypto, forex, futures
✔️ Fully customizable — make it yours
✔️ Perfect for scalpers, day traders, and swing traders alike
📌 Created by:
“Volume is money voting. Let it speak to you through bubbles.”
📌 Add this tool to your arsenal — and never miss a significant volume pulse again!
💡 Pro Tip: Enable alerts to get notified about unusual volume spikes — even when you’re away from your charts.
Cari dalam skrip untuk "VOLUME BAR"

High Volume AlertThe High Volume Alert Script is developed for all traders focusing on volume analysis in their trading strategies, providing alerts for unusually high trading volumes during specified trading sessions.
Functionality:
Volume Moving Average Calculation:
Average Volume = Moving Average(Volume) = Sum of last the x last candles Volume
Where n is the user-defined period for the moving average calculation (denoted as movingaverageinput in the script. This moving average serves as the baseline to compare current volume levels against historical averages.
High Volume Detection:
HighVolume = CurrentVolume >= (MA(Volume) x HighVolumeRatio)
Here, HighVolumeRatio is a user-defined multiplier that sets the threshold for what is considered high volume. If the current volume exceeds this threshold (the product of the moving average of volume and the HighVolumeRatio ), the script identifies this as a high-volume event.
Session Filtering:
The script further refines these alerts by ensuring they only trigger during the specified trading session, enhancing relevance for traders interested in specific market hours. This session is defined by the sess and timezone parameters.
Visualisation and Alerts:
If high volume is detected (HighVolume = True), the script colors the volume bar with the highVolumeColor . If the option is selected, it also changes the color of the candlestick to either highVolumeCandleColorUp (for bullish candles) or highVolumeCandleColorDown (for bearish candles), depending on the price movement within the high-volume period. An alert is generated through the alertcondition function when high volume is detected during the specified session, notifying the trader of potentially significant market activity.
Application in Trading:
This indicator serves traders who prioritize volume as a leading indicator of potential price movement. High trading volumes may indicate the presence of significant market activity, often associated with events like news releases, market openings, or large trades, which can precede price movements.
Originality and Practicality:
This script is self-developed, aiming to fill the gap in automatic ratio adjusted volume alerts within the TradingView environment.
Conclusion:
The High Volume Alert Script is an essential tool for traders who integrate volume analysis into their strategy, offering tailored alerts and visual cues for high volume periods.
Compliance and Limitations:
The script complies with TradingView scripting standards, ensuring no lookahead bias and maintaining real-time data integrity. However, its utility depends on the availability on volume data, and please be aware that forex pairs never offer real volume data, this tool is best used with a exchange traded symbol.
Traders Reality PVSRA Volume SuitePVSRA volume bars color coded to PVSRA vector candles and with override option and configurable moving average.
Indicator displays volume bars color coded to PVRSA price action and allows the user to override the chart symbol.
Developed for TradersReality by infernixx with library conversion by peshocore.
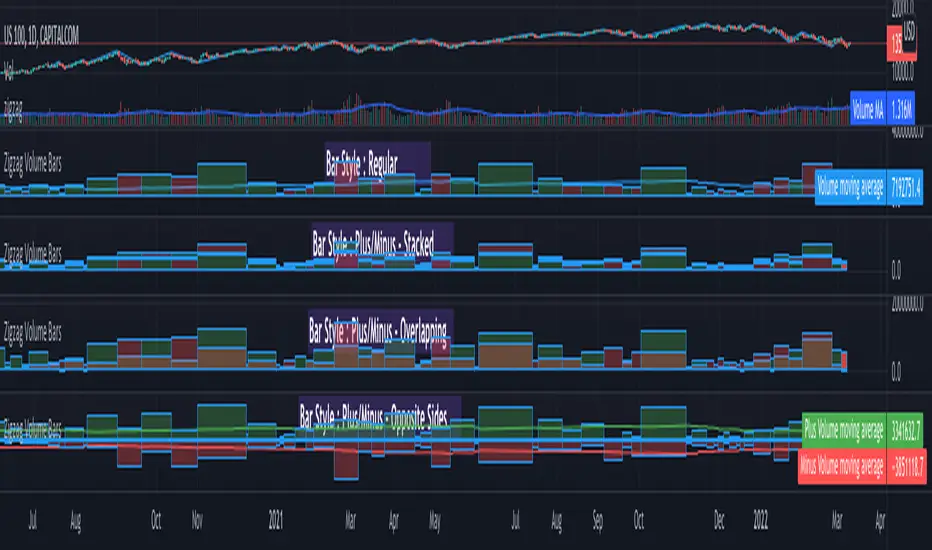
Zigzag Volume BarsBack to my favourite topic - Zigzags.
Here is an indicator which can help you visualise volume data on Zigzag swing highs and lows.
Settings are pretty simple and provides variety of display options
Display options are as demonstrated in the chart has following main types.
Regular
Plus/Minus - Stacked
Plus/Minus - Overlapping
Plus/Minus - Opposite Sides
Apart from the main display types, stacked display has several sub-types which determine whether to place green bar below red or the other way around.
Snapshot below shows example of each type.
Ranged Volume - evoA simple script that shows mirrored regular volume bars with the purpose to show break-outs and low volume ranges, using highest and lowest of a few bars back.
Use Heikin Ashi function to smooth the colors with the trend.

Breakout Volume
指标名称:Breakout Volume (BrkVol)
功能:本指标用于识别成交量异常放大,同时结合价格新高,帮助交易者发现潜在突破机会。
主要特性:
可调成交量均线周期(MA Length)
可调放量倍数(Volume Multiplier)
可调价格新高周期(Lookback High Length)
成交量柱颜色区分:绿色=阳线放量,红色=阴线放量,灰色=无信号
蓝色均量阈值线,可直观比较放量情况
出现成交量突破 + 新高时,图表上显示绿色三角形标记
支持提醒功能,可在条件触发时收到通知
使用建议:
调整参数以适应不同品种和时间周期
可结合趋势、支撑阻力位使用,避免假信号
适合快速发现短线或中长线突破机会
English Description
Name: Breakout Volume (BrkVol)
Function: This indicator detects unusual volume spikes combined with new highs in price, helping traders identify potential breakout opportunities.
Key Features:
Adjustable moving average period (MA Length) for volume
Adjustable volume multiplier (Volume Multiplier)
Adjustable lookback period for price highs (Lookback High Length)
Color-coded volume bars: Green = bullish candle with volume breakout, Red = bearish candle with volume breakout, Gray = normal volume
Blue threshold line (volume MA × multiplier) for easy comparison
Green triangle marker appears when both volume breakout and new high conditions are met
Supports alerts for real-time notifications
Usage Tips:
Adjust parameters to suit different symbols and timeframes
Combine with trend or support/resistance levels to reduce false signals
Useful for spotting short-term or medium/long-term breakout opportunities

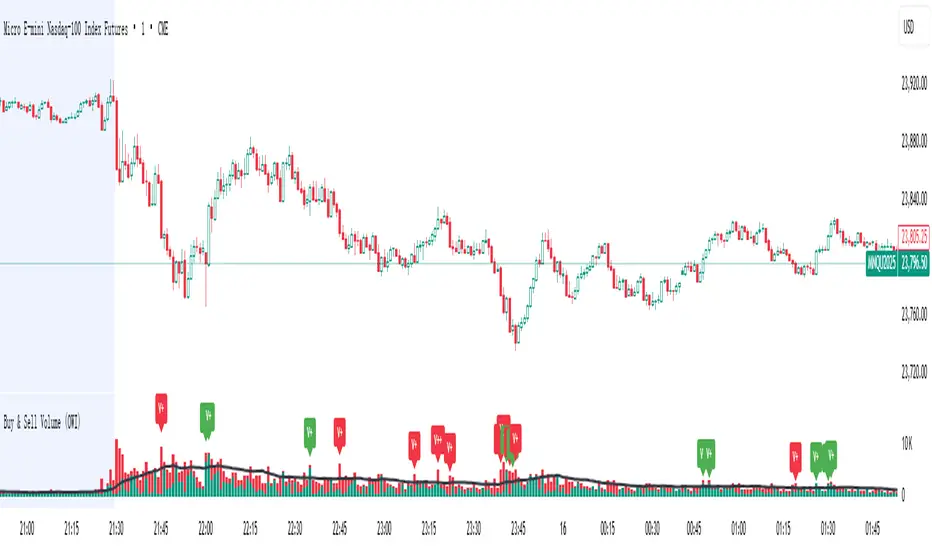
Buy & Sell Volume (OWI)📊 Buy & Sell Volume (OWI) Indicator Guide
The Buy & Sell Volume (OWI) indicator is designed to provide a visual breakdown of buying and selling pressure in each candle, helping traders identify volume surges and potential market moves. It also includes a time filter to focus analysis during key trading hours.
⚙️ Setup & Inputs
When adding the indicator to your chart, you'll see several configurable inputs:
SMA Length : Sets the period for the Simple Moving Average (SMA) of total volume.
Enable Time Filter : Toggles whether to restrict analysis to US market hours (Eastern Time). |
Start Hour/Minute : Defines the beginning of the time filter window (default: 9:45 ET). |
End Hour/Minute : Defines the end of the time filter window (default: 16:15 ET). |
📈 How It Works
🔍 Volume Breakdown
Buy Volume: Estimated volume attributed to buyers, calculated based on candle position.
Sell Volume: Estimated volume attributed to sellers.
Total Volume SMA: A moving average of total volume to benchmark current activity.
⏰ Time Filter (Optional)
When enabled, the indicator only highlights volume spikes during the specified US market hours. This helps filter out noise from pre-market or after-hours trading.
🚨 Highlight Conditions
The indicator flags significant volume spikes with labels above the volume bars:
| Label | Condition |
| V+ | Volume is between 1.5× and 2× the SMA, during market hours (if enabled). |
| V++ | Volume exceeds 2× the SMA, during market hours (if enabled). |
💡 Tips
- Use shorter SMA lengths for more reactive volume analysis.
- Change the time filter if you're trading outside US market hours.
- Combine with candlestick patttern to confirm breakout or reversal signals.
Volume Intelligence Suite (VIS) v2📊 Volume Intelligence Suite – Smart Volume, Smart Trading
The Volume Intelligence Suite is a powerful, all-in-one TradingView indicator designed to give traders deeper insight into market activity by visualizing volume behavior with price action context. Whether you're a scalper, day trader, or swing trader, this tool helps uncover hidden momentum, institutional activity, and potential reversals with precision.
🔍 Key Features:
Dynamic Volume Zones – Highlights high and low volume areas to spot accumulation/distribution ranges.
Volume Spikes Detector – Automatically marks abnormal volume bars signaling potential breakout or trap setups.
Smart Delta Highlighting – Compares bullish vs bearish volume in real time to reveal buyer/seller strength shifts.
Session-Based Volume Profiling – Breaks volume into key trading sessions (e.g., London, New York) for clearer context.
Volume Heatmap Overlay – Optional heatmap to show intensity and velocity of volume flow per candle.
Custom Alerts – Built-in alerts for volume surges, divergences, and exhaustion signals.
Optimized for Kill Zone Analysis – Pairs perfectly with ICT-style session strategies and Waqar Asim’s trading methods.
🧠 Why Use Volume Intelligence?
Most traders overlook the story behind each candle. Volume Intelligence Suite helps you "see the why behind the move" — exposing key areas of interest where smart money may be active. Instead of reacting late, this tool puts you in position to anticipate.
Use it to:
Validate breakouts
Detect fakeouts and liquidity grabs
Confirm bias during kill zones
Analyze volume divergence with price swings
⚙️ Fully Customizable:
From volume thresholds to visual styles and session timings, everything is user-adjustable to fit your market, timeframe, and strategy.
✅ Best For:
ICT/Smart Money Concepts (SMC) traders
Breakout & reversal traders
Kill zone session scalpers
Institutional footprint followers

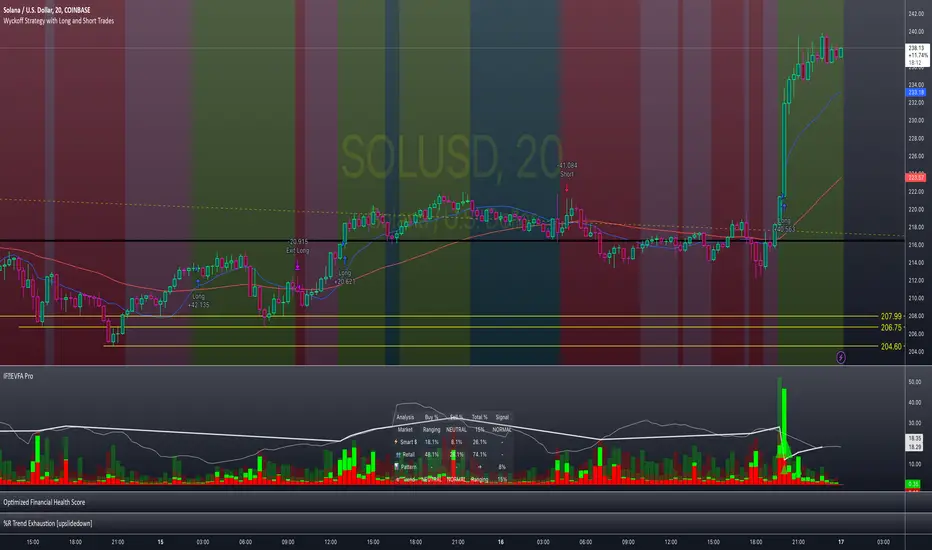
Enhanced Volume Flow Analysis Pro ♾️ IFEnhanced Volume Flow Analysis Pro (EVFA Pro)
A Comprehensive Guide to Understanding and Using Volume Flow Analysis
Introduction
The Enhanced Volume Flow Analysis Pro (EVFA Pro) represents a sophisticated approach to understanding market dynamics through the lens of volume analysis. This advanced technical indicator has been designed to peel back the layers of market activity, revealing the intricate dance between institutional and retail traders. By combining volume analysis, participant behavior patterns, and market condition recognition, EVFA Pro provides traders with a deeper understanding of market movements and potential opportunities.
Understanding the Core Framework
At its heart, EVFA Pro works by analyzing and categorizing trading volume based on several key characteristics. The indicator examines not just the raw volume, but also the context in which that volume occurs. It considers factors such as price movement, historical patterns, and market conditions to classify trading activity as either institutional or retail in nature.
The framework adapts dynamically to different market environments. Whether you're trading stocks, ETFs, cryptocurrencies, or commodities, the indicator automatically adjusts its parameters to match the typical behavior patterns of each asset class. This adaptability extends to different trading styles as well, with optimizations for everything from quick-paced scalping to longer-term position trading.
Market Participant Analysis
One of the most powerful aspects of EVFA Pro is its ability to distinguish between institutional and retail trading activity. The indicator accomplishes this through a sophisticated analysis of volume patterns, order flow, and price action. Institutional trading typically leaves distinct footprints in the market - large, well-organized volume patterns that often occur at strategic price levels. EVFA Pro identifies these patterns and separates them from the more scattered, emotion-driven patterns typical of retail trading.
The indicator maintains a constant watch on participation rates from both groups. When institutional participation rises above normal levels, it could signal the beginning of a significant move. Similarly, spikes in retail activity, especially when combined with certain price patterns, might indicate potential market turning points.
Reading Market Conditions
Market conditions are not static, and EVFA Pro recognizes this fundamental truth. The indicator continuously evaluates market conditions, classifying them into four main categories: normal, volatile, ranging, and trending. This classification isn't merely descriptive - it directly influences how the indicator interprets various patterns and signals.
In volatile markets, the indicator becomes more conservative in its pattern recognition, requiring stronger confirmation before signaling potential opportunities. During ranging periods, it adjusts to look for shorter-term movements and potential breakout scenarios. In trending markets, the focus shifts to finding continuation patterns and potential exhaustion points.
Pattern Recognition and Signal Generation
Pattern recognition in EVFA Pro goes beyond simple technical patterns. The indicator looks for complex interactions between volume, price, and participant behavior. It identifies accumulation patterns - periods where institutional buyers are actively building positions, often while keeping price movements relatively subtle to avoid drawing attention. Similarly, it recognizes distribution patterns, where larger players are gradually reducing positions.
Signal generation involves a sophisticated weighing of multiple factors. Volume strength, institutional participation, trend alignment, and price momentum all play roles in determining signal strength. This multi-factor approach helps reduce false signals and provides a more reliable indication of potential market moves.
Visual Analysis Tools
The visual components of EVFA Pro have been carefully designed to present complex information in an intuitive format. The main chart overlay uses color-coded volume bars to show the relative participation of institutional and retail traders. The intensity of these colors varies with volume significance, helping traders quickly identify potentially important market activity.
The information table provides a real-time summary of market conditions, participant activity, and detected patterns. This dashboard-style display allows traders to quickly assess market conditions and potential opportunities without needing to analyze multiple indicators.
Practical Application in Trading
To use EVFA Pro effectively, traders should integrate it into a comprehensive trading strategy. The indicator works best when its signals are considered alongside other forms of analysis and risk management tools. Strong signals from EVFA Pro might suggest potential opportunities, but traders should always consider the broader market context, their own risk tolerance, and their overall trading plan.
The indicator's alerts system can help traders stay informed of potentially significant market developments. However, these alerts should be viewed as starting points for analysis rather than automatic trading signals. Each alert provides specific information about the type of pattern or condition detected, allowing traders to quickly assess whether further investigation is warranted.
Advanced Features and Customization
EVFA Pro offers extensive customization options to suit different trading styles and preferences. Traders can adjust sensitivity levels, color schemes, and display options to match their needs. The indicator also includes special considerations for different trading sessions, allowing for more accurate analysis during pre-market, regular trading hours, and after-hours periods.
Market Application and Interpretation
Success with EVFA Pro comes from understanding not just what it shows, but why it shows what it does. The indicator's patterns and signals reflect real market dynamics - the actions and reactions of different types of traders. By understanding these underlying dynamics, traders can make more informed decisions about market opportunities and risks.
Disclaimer
This indicator and documentation are provided for educational and informational purposes only. Trading in financial markets involves substantial risk of loss and is not suitable for every investor. The analysis provided by the Enhanced Volume Flow Analysis Pro indicator should not be considered as financial advice or a recommendation to make any specific trade or investment. Users of this indicator should understand that:
1. Past performance is not indicative of future results
2. All trading decisions and their outcomes are the responsibility of the individual trader
3. This tool should be used as part of a comprehensive trading strategy that includes proper risk management and due diligence
4. Markets can be highly unpredictable, and no technical analysis tool can guarantee success
Users should carefully consider their investment objectives, level of experience, and risk appetite before using this indicator. It is strongly recommended to consult with a qualified financial advisor before making any investment decisions.
Smart Money — Volume Panel + OBV Smart Money — Volume Panel + Scaled OBV
This indicator combines classic volume analysis with a scaled On-Balance Volume (OBV) line, helping spot smart money activity:
Volume bars – color changes dynamically:
🟢 green = high volume & OBV rising
🔴 red = high volume & OBV falling
🟠 orange = high volume but OBV neutral
⚪ gray = low volume
Yellow line – volume moving average (MA)
Purple line – high-volume threshold (MA × multiplier)
OBV line (green/red) – scaled OBV plotted in the same range as volume for easier comparison.

Volume Spike Analyzer(SMA10-Based)📊 **Volume Spike Analyzer (SMA10-Based)**
This indicator highlights abnormal volume activity by comparing current volume to the 10-period Simple Moving Average (SMA) of volume. It helps traders visually identify unusual activity that may precede breakouts, reversals, or news-driven moves.
---
🔧 **Features:**
• ✅ Colors volume bars:
• Green = Volume > SMA(10)
• Red = Volume ≤ SMA(10)
• ✅ Detects and labels spike levels:
• 🔶2x — Volume > 2x SMA(10)
• 🟢3x — Volume > 3x SMA(10)
• 🔴4x — Volume > 4x SMA(10)
• ✅ Built-in alerts for all 3 spike levels
---
📈 **Best Use Cases:**
• Confirm breakouts with strong volume
• Detect accumulation/distribution
• Filter low-volume setups
• Combine with VWAP/EMA for directional confirmation
---
⏱️ **Recommended Timeframes:**
• Intraday: 5m, 15m, 1h
• Also works on daily for swing trades
---
🧠 **Pro Tips:**
• Use with VWAP or EMA(20/50/200) for confluence
• Add SMA(Volume, 10) to your price chart for quick correlation
• Combine with candle pattern detection for signal validation
---

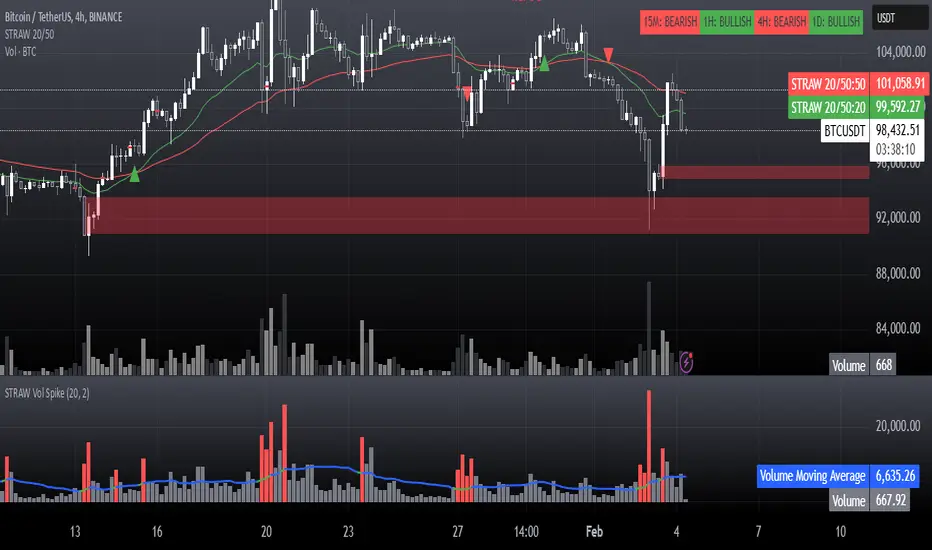
STRAW Volume Spike IndicatorThis is basically a:
High-Volume Impulse Detector
The High-Volume Impulse Detector is a refined tool designed to highlight key moments of explosive volume surges in the market, specifically calibrated for assets like Bitcoin on the 15-minute timeframe. Unlike generic volume-based indicators, this script doesn’t just flag high volume—it intelligently adapts to market dynamics by incorporating a custom-moving average baseline and highlighting instances where volume exceeds a significant threshold relative to the average.
Key Features
✅ Adaptive Volume Benchmark – Uses a dynamic moving average to filter out noise and pinpoint meaningful volume spikes.
✅ Impulse Confirmation – Only highlights volume bars that exceed the 50% threshold above the baseline, ensuring signals capture real liquidity shifts.
✅ Smart Color Coding – Differentiates high-impact bullish and bearish volume with distinct visual cues for easy market structure identification.
✅ Designed for Order Block Traders – Helps validate liquidity-driven price movements essential for refining order block and break-of-structure strategies.
Unlike conventional volume overlays, this tool helps traders connect volume surges to key structural shifts, making it an ideal companion for those navigating momentum shifts, market inefficiencies, and institutional footprints.
⚡ Best used on BTC 15m for tracking aggressive volume-driven moves in real-time.
Projected VolumeOverview
The indicator displays the expected volume up to the closing time of the session.
Calculations
The real volume is proportional to the projected volume, just as elapsed session time is proportional to entire trading session. Knowing the actual volume, the elapsed time of the session and the total time of the trading session, it is possible to find out the projected volume.
How It Works
On the last volume bar, the indicator shows the projected volume overlapped with the real volume.
How To Use
Assuming that any price movement is of little relevance if not confirmed with considerable volume, if a strong signal appears on the intraday chart but with low volume, we can overlook it as the projected volume on the daily chart is high and indicates that there is a high chance of directional movement for the day. In short, even if we have an entry signal with low volume on the intraday chart, it will still be viable to open a trade as long as on the daily chart the projected volume is high, i.e, above the moving average.
Inputs
Use 24 hours in Trading Hours input for nonstop markets, like crypto and forex, or set the specific trading hours for other market types like stocks. The projected volume will be displayed on all timeframes if the value is equal to 24. For other values it will be displayed on the 1-day chart only.

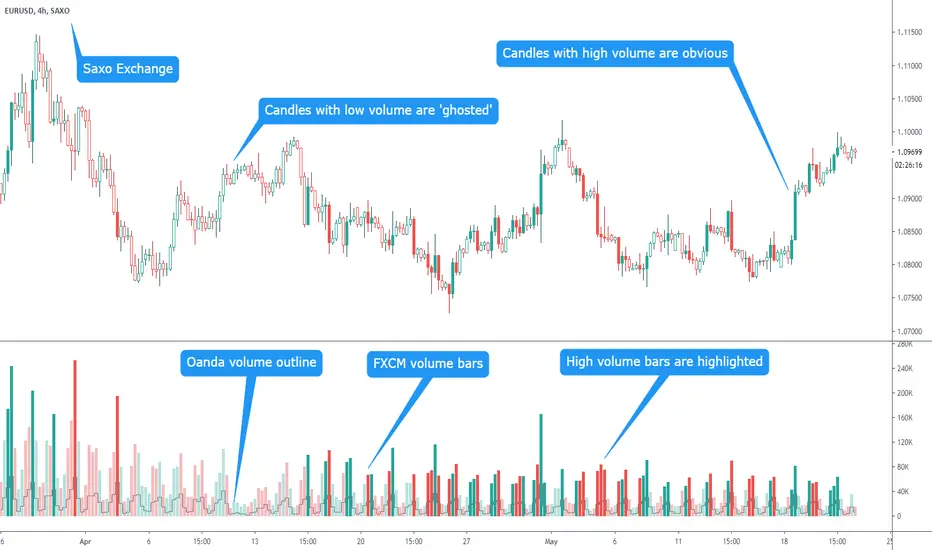
Multi-Exchange Volume w Candle HighlightI've been investigating the value of studying candle volume. I realised all the exchanges give different volume. So I've made an indicator that shows the volume from multiple exchanges.
You can choose a primary exchange for the main changes and a secondary exchange for a line chart in front. These exchanges are INDEPENDANT of the exchange you are looking at so if your broker does not show volume, you can use the volume supplied by another broker who does. For example, you might be looking at a chart from Saxo exchange (who I don't think supplies volume) but see volume from FXCM as the primary with pattern confirmation from Oanda as the secondary.
You'll can see the patterns are the same but FXCM has higher overall volume than Oanda
In addition you can choose to highlight the high volume bars and highlight the high volume candles.
I find it useful as I can look at a move and easily see whether there is volume behind it - if there is a move with low volume is it sustainable?
You have the option to switch all the extra features on and off so if you prefer you can just look at a classic volume chart whilst looking at a candle chart from an exchange that does not supply volume.
I'm honest as to whether I find my scripts useful in my trading (they are always technically correct) or not and I think this one is good.
Volume x PriceThis is a simple indicator that calculates volume times price (money volume). Both asset volume and money volume are important indicators in TA. As you can see in the chart above, money volume (moving average) was increasing while the asset volume was not during late 2017. This could have led to wrong interpretations. Money volume becomes more important to consider when the difference in asset price is 'relatively' high.
Features:
- In addition to default options on volume indicator, it is possible to color volume bars based on "money flow multiplier" sign (close-(low+high)/2)
- Money factor can be disabled to show regular volume
Note: Most exchanges show asset volume but there are some like Bitmex that show money volume. Using this indicator on Bitmex type tickers should be avoided.
PS: I couldn't find any indicator for money volume so I had to develop this.
Your feedback is very welcome. If you know similar indicators, please let me know.
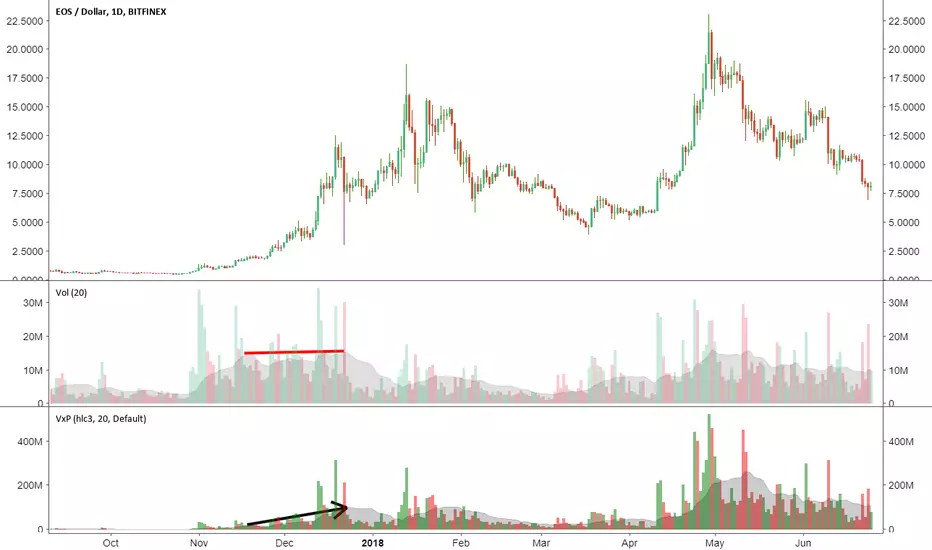
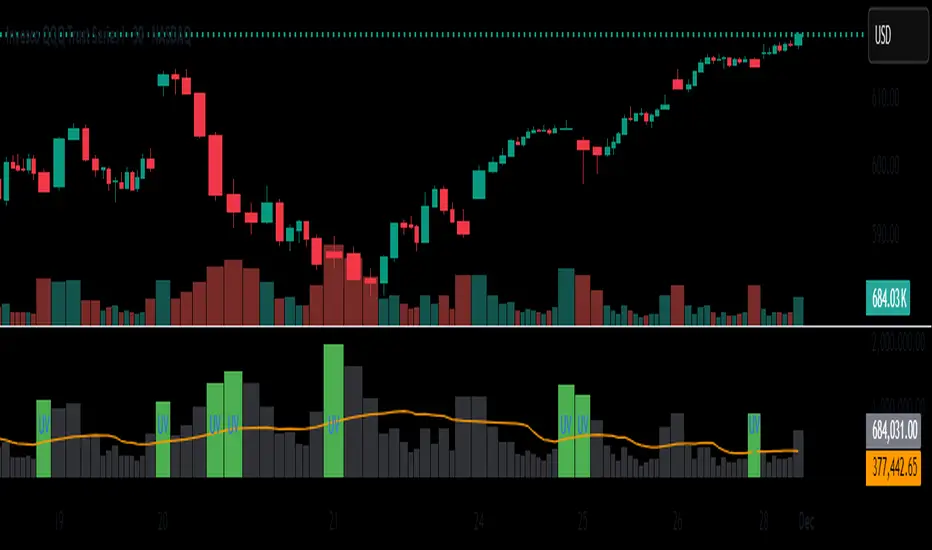
Unusual Volume//@version=5
indicator("Unusual Volume", overlay=false)
// --- Inputs ---
len = input.int(20, "Average Volume Length", minval=1)
mult = input.float(2.0, "Unusual Volume Multiplier", step=0.1)
// --- Calculations ---
avgVol = ta.sma(volume, len)
ratio = volume / avgVol
isBigVol = ratio > mult
// --- Plots ---
plot(volume, "Volume", style=plot.style_columns,
color = isBigVol ? color.new(color.green, 0) : color.new(color.gray, 60))
plot(avgVol, "Average Volume", color=color.orange)
// Mark unusual volume bars
plotshape(isBigVol, title="Unusual Volume Marker",
location=location.bottom, style=shape.triangleup,
color=color.green, size=size.tiny, text="UV")
// Optional: show ratio in Data Window
var label ratioLabel = na
Hybrid Flow Master📊 Hybrid Flow Master - Professional Trading Indicator
Overview
Hybrid Flow Master is an advanced all-in-one trading indicator that combines Smart Money Concepts, institutional order flow analysis, and multi-timeframe confluence scoring to identify high-probability trade setups. Designed for both scalpers and swing traders across all markets (Forex, Crypto, Stocks, Indices).
🎯 Key Features
1. Intelligent Confluence System (0-100% Scoring) Proprietary scoring algorithm that weighs multiple factors Only signals when minimum confidence threshold is met
Real-time probability calculations for each setup Signal quality grading: A+, A, B, C ratings
2. Smart Money Concepts (SMC)
Automatic Order Block detection (bullish/bearish) Fair Value Gap (FVG) identification
Market structure analysis (Higher Highs, Lower Lows) Swing high/low tracking with visual markers
3. Multi-Timeframe Analysis
Higher timeframe trend filter for confluence Customizable HTF periods (1H, 4H, Daily, etc.)
Prevents counter-trend trades Aligns entries with major trends
4. Volume Flow Analysis
Volume spike detection with customizable thresholds Volume delta calculations (buying vs selling pressure) Institutional footprint identification Background highlighting for high-volume bars
5. Advanced Risk Management
ATR-based stop loss calculation Automatic take profit levels Customizable risk/reward ratios (1:1, 1:2, 1:3+) Visual SL/TP lines on chart Position sizing guidance
6. Professional Dashboard
Real-time HUD displaying:
Market bias (Bullish/Bearish/Neutral)
Higher timeframe trend status
Current confluence percentage
Volume status (Normal/High)
RSI reading with color coding
ATR volatility measure
Signal quality grade
7. Smart Alert System
Bullish confluence signals
Bearish confluence signals
Volume spike notifications
Customizable alert messages
Works with mobile app notifications
📈 What Makes It Unique?
✅ No Repainting - All signals are confirmed and final
✅ Probability-Based - Shows confidence level, not just binary signals
✅ Multi-Factor Confluence - Combines structure, volume, momentum, and HTF analysis
✅ Clean Interface - Toggle individual components on/off
✅ Works on All Timeframes - From 1-minute scalping to daily swing trading
✅ Universal Markets - Forex, Crypto, Stocks, Indices, Commodities
🎨 Customization Options
Adjustable swing detection length
Volume threshold settings
Minimum confluence score filter
Custom color schemes
Dashboard position (4 corners)
Show/hide individual components
Risk/reward ratio adjustment
ATR multiplier for stops
📊 Best Used For:
✔️ Scalping (1m - 15m charts)
✔️ Day Trading (15m - 1H charts)
✔️ Swing Trading (4H - Daily charts)
✔️ Trend Following
✔️ Reversal Trading
✔️ Breakout Trading
💡 How to Use:
Add indicator to chart - Works immediately with default settings Set your timeframe - Choose your trading style Wait for signals - Green BUY or Red SELL labels with confidence %
Check confluence score - Higher % = better quality setup Review dashboard - Confirm market bias and HTF trend Manage risk - Use provided SL/TP levels or adjust to your preference
Set alerts - Get notified of high-probability setups
⚙️ Recommended Settings:
For Scalping (1m-5m):
Swing Length: 5-7
Min Confluence: 70%
HTF: 15m or 1H
For Day Trading (15m-1H):
Swing Length: 10-15
Min Confluence: 60%
HTF: 4H or Daily
For Swing Trading (4H-Daily):
Swing Length: 15-20
Min Confluence: 50-60%
HTF: Weekly
📚 Indicator Components:
✦ Market Structure Detection
✦ Order Block Identification
✦ Fair Value Gaps (FVG)
✦ Volume Analysis
✦ RSI (14)
✦ MACD (12, 26, 9)
✦ ATR (14)
✦ Multi-Timeframe Trend
✦ Confluence Scoring Algorithm
🚀 Performance Notes:
Optimized for speed and efficiency Minimal CPU usage Clean chart presentation
Limited drawing objects (no chart clutter) Works on all TradingView plans
⚠️ Important Notes:
This indicator is a tool to assist trading decisions, not financial advice Always use proper risk management (1-2% per trade recommended) Backtest on your preferred market and timeframe
Combine with your own analysis and strategy Past performance does not guarantee future results
🔔 Alert Setup:
Right-click indicator name → "Add Alert" → Choose:
"Bullish Confluence Signal" for buy setups
"Bearish Confluence Signal" for sell setups
"Volume Spike Alert" for unusual activity
💬 Support:
For questions, suggestions, or custom modifications, feel free to message me directly through TradingView.

RSI Momentum ScalperOverview
The "RSI Momentum Scalper" is a Pine Script v5 strategy crafted for trading highly volatile markets, with a special focus on newly listed cryptocurrencies. This strategy harnesses the Relative Strength Index (RSI) alongside volume analysis and momentum thresholds to pinpoint short-term trading opportunities. It supports both long and short trades, managed with customizable take profit, stop loss, and trailing stop levels, which are visually plotted on the chart for easy tracking.
Why I Created This Strategy
I developed the "RSI Momentum Scalper" because I was seeking a reliable trading strategy tailored to newly listed, highly volatile cryptocurrencies. These assets often experience rapid price fluctuations, rendering traditional strategies less effective. I aimed to create a tool that could exploit momentum and volume spikes while managing risk through adaptable exit parameters. This strategy is designed to address that need, offering a flexible approach for traders in dynamic crypto markets.
How It Works
The strategy utilizes RSI to identify momentum shifts, combined with volume confirmation, to trigger long or short entries. Trades are controlled with take profit, stop loss, and trailing stop levels, which adjust dynamically as the price moves in your favor. The trailing stop helps lock in profits, while the plotted exit levels provide clear visual cues for trade management.
Customizable Settings
The script is highly customizable, allowing you to adjust it to various market conditions and trading styles. Here’s a brief overview of the key settings:
Trade Mode: Select "Both," "Long Only," or "Short Only" to determine the trade direction.
(Default: Both)
RSI Length: Sets the lookback period for the RSI calculation (2 to 30).
(Default: 8)
A shorter length increases RSI sensitivity, suitable for volatile assets.
RSI Overbought: Defines the upper RSI threshold (60 to 99) for short entries.
(Default: 90)
Higher values signal stronger overbought conditions.
RSI Oversold: Defines the lower RSI threshold (1 to 40) for long entries.
(Default: 10)
Lower values indicate stronger oversold conditions.
RSI Momentum Threshold: Sets the minimum RSI momentum change (1 to 15) to trigger entries.
(Default: 14)
Adjusts the sensitivity to price momentum.
Volume Multiplier: Multiplies the volume moving average to filter high-volume bars (1.0 to 3.0).
(Default: 1)
Higher values require stronger volume confirmation.
Volume MA Length: Sets the lookback period for the volume moving average (5 to 50).
(Default: 13)
Influences the volume trend sensitivity.
Take Profit %: Sets the profit target as a percentage of the entry price (0.1 to 10.0).
(Default: 4.15)
Determines when to close a winning trade.
Stop Loss %: Sets the loss limit as a percentage of the entry price (0.1 to 6.0).
(Default: 1.85)
Protects against significant losses.
Trailing Stop %: Sets the trailing stop distance as a percentage (0.1 to 4.0).
(Default: 2.55)
Locks in profits as the price moves favorably.
Visual Features
Exit Levels: Take profit (green), fixed stop loss (red), and trailing stop (orange) levels are plotted when in a position.
Performance Table: Displays win rate, total trades, and net profit in the top-right corner.
How to Use
Add the strategy to your chart in TradingView.
Adjust the input settings based on the cryptocurrency and timeframe you’re trading.
Monitor the plotted exit levels for trade management.
Use the performance table to assess the strategy’s performance over time.
Notes
Test the strategy on a demo account or with historical data before live trading.
The strategy is optimized for short-term scalping; adjust settings for longer timeframes if needed.

PVSRA Volume Price - Some people say "Price Action is King". I say, we cannot know how the MMs (Market Makers) will move price next, period. But price tends to consolidate above key SR when MMs are filling short orders for SM (Smart Money) and long orders for DM (Dumb Money), and price tends to consolidate below key SR when MMs are filling long orders for SM and short orders for DM. The MMs are also "SM", and they tend to do the other SMs "one better"! This means that after the MMs fill the SM/DM orders, they might move price a bit further in an attempt to stop out some of those SM executed orders and sucker in more DM; both giving liquidity for the MMs to add to their own SM side position. Yes, the MMs are bastards. But the point is that could leave price not "nicely" above or below a SR anymore, yet more consolidation can occur.
Volume - Increases in activity denote increase in interest. But, is it long or short interest? Where is price in the bigger picture when this is happening? Is it at relative highs, or lows in the overall price action? And if a high volume bar is for a candle which you can examine by going to lower TF charts, you might see where in the spread of that candle the most volume occurred, high or low! Using volume is about taking note of relative increases in volume and what price is doing at the same time. Are the better volumes favoring the lower or the higher prices, as the MMs waffle price up and down? And do the volumes get particularly notable when the MMs take price above or below key SR?
S&R - Read all about S&R at "Baby Pips.com". What I want you to realize here is that the whole, half and quarter numbered price levels (hereinafter referred to as "Levels") are the most important SR of all in this market! Not because price stops, pauses, proceeds or reverses there, but because it is above or below these levels that important consolidation (MMs filling SM orders) takes place. Once SM long orders are filled, they become interested in placing orders to close them at higher prices, and hence the MMs will be moving price higher, eventually. Once SM short orders are filled, they become interested in placing orders to close them at lower prices, and hence the MMs will be moving price lower, eventually.
PVSRA - If we can spot consolidations above/below key SR, examine the overall price action on various TF charts, and take note of where the notable increases in volume have most recently occurred (did volume favor relative highs or lows), then we can build a consensus about what kind of orders the MMs have most recently been filling; buying to open longs or close shorts, or selling to open shorts or close longs. And we can get a better idea if things will next become bullish or bearish. And once PA confirms our bullish or bearish PVSRA results, by recognizing the importance of Levels we can look beyond current PA in the direction it is going and look to historic PA S&R (consolidation around key Levels) to come up with candidates for where the price might be headed. And bull or bear swings typically run in terms of 100+, 150+, 200+ pips, .....etc. And now you know why.
Okay. Now, if this is your first introduction to PVSRA, and having just read the above, you are likely scratching your head and still confused. That is normal. I will tell you a secret about the market and why you have a right to be confused. The secret is this. The market cannot be defined by mathematics nor by immutable logic. This is why the most advanced mathematicians over a century have never even come close to cracking the market. It cannot be done. Something else, other than math and immutable logic is the fundamental operand in the market. Have you ever watched a child attempt a jigsaw puzzle for the first time? And watched as that child grew and attempted more of them, and more complex ones? What is at work in the market I will elaborate on later, but for now trust me in this. We need to apply ourselves to learning how to do PVSRA just as a child attacks learning how to do jigsaw puzzles. And we must continue doing PVSRA, because in time our mind will "learn" when we have just picked up an important piece of the puzzle, and that we know where it goes! Developing the skill of PVSRA is an art form. We must not allow ourselves to feel badly if we miss clues. PVSRA is an art form that takes time to perfect. Over time our skill will grow and our "read" of the unpredictable market will improve. We must take to ongoing learning and application of PVSRA.
Introduction to How the Market Really Works
Does anybody remember the "lil' Abner" cartoons in the Sunday papers? Let me draw for you a mental picture of how the market really works.....
Imagine Daddy Yokum ferociously racing a buckboard wagon up and down the steep inclines and declines in the rough, rocky mountain road that has sharp turns and a sheer cliff on one side. The wagon wheels are spewing rocks off the side of the cliff! Even Daddy Yokum's shotgun is going off due to the jolting of the buckboard! Daddy Yokum has a demented look on his face, but he is smiling! The horse has a wild look in it's eyes and is frothing at the mouth. There are two passengers being tossed around in the back of the buckboard, terror stricken! Now, let's pan back from this cartoon picture and place the labels needed. On the side of the wagon is the sign "Market Pricing". The demented, smiling Daddy Yokum, is the Market Maker. The passengers being tossed around are the buyers and sellers.
.....Got it? Market prices are not determined by the buyers and sellers. They are determined by the Robber Bank Market Makers (MMs).
MMs are Market Manipulators of Price, and Thieves!
The "market" is the sole creation of the Robber Banks that "make the market". While it serves the world of commerce, they run it to make profits. And they opened the market up to foster prolific currency trading by others for the sole purpose of making more profits. They move prices up and down to "create liquidity" to fill the orders of SM (Smart Money) and DM (Dumb Money), for the commissions they make by filling the orders. When they have some orders above the current price and some below the current price, who do you think determines the sequence of direction and distance the price is going to move so these orders can be filled? And always - since they know how they are going to move price next - they take positions themselves to make additional profits.
They do this by:
1. Manipulating price to sucker into the market DM that is taking the wrong side position.
2. Manipulating price to sucker into the market SM that is taking the right side position, but too soon, and later manipulating price to hit their stops.
They have total control of pricing, and by these actions they effectively "steal" from others the money to fill their own "right side" positions before moving the price to the next area they have decided on for filling orders, and for taking profit on their positions built beforehand. Don't get me wrong. I do not object to the market volatility these thieving Robber Banks create. We need it. But we also need to understand what these people are like, the cloth they are cut from. They are crooks, and we have to be extra careful about trading in the market they operate. On some special days you can see them in their true colors. We should witness it. Take note of it. Speak of it. And remember it!

Volume Average Cross - VAC DefaultVolume Average Cross Default Indicator
This indicator plots signals from two different visual volume averages when they cross.
In does in addition to that show the default volume bars.
This is VAC Default. If you need to see the crosses on your chart and not on the volume bars please go to my VAC Chart Indicator.
Rules:
Fast Volume Period always has to be lower than the Slow Volume Period to trigger correct signals.
Inputs:
-> Fast Volume Average Period
-> Slow Volume Average Period
-> Option to enable/disable the cross-signals and to show/hide both volume averages.

Colored Volume Bars All Markets: Combining Volume SourcesUsing volume in Forex is potentially misleading as we are only provided the broker volume or futures exchange volume for the currency or commodity in a decentralised market. This code combines the volumes from FXCM, Onanda and futures for the instrument being studied. The combination of the volumes could improve the reliability of the volume being considered. Using this approach other volume indicators can also be improved.

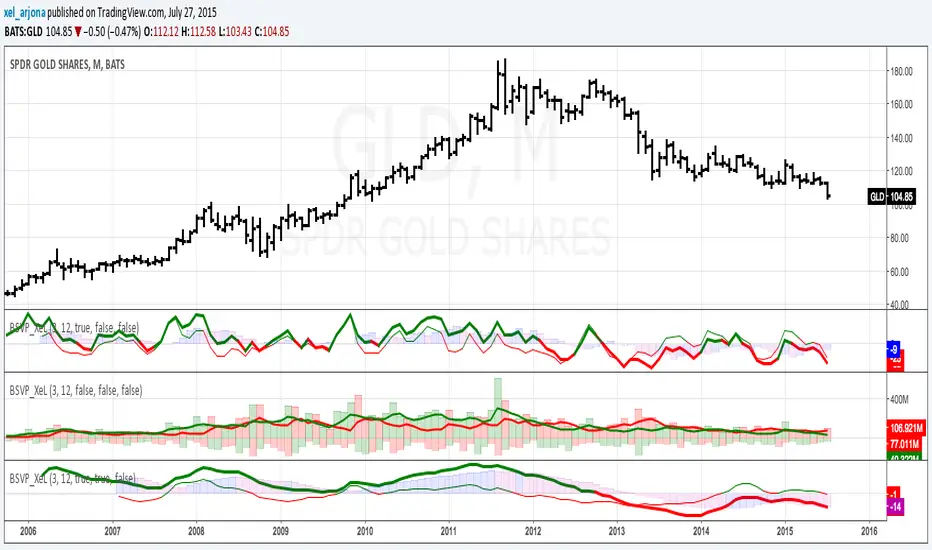
BUY & SELL VOLUME TO PRICE PRESSURE by @XeL_ArjonaBUY & SELL PRICE TO VOLUME PRESSURE
By Ricardo M Arjona @XeL_Arjona
DISCLAIMER:
The Following indicator/code IS NOT intended to be a formal investment advice or recommendation by the author, nor should be construed as such. Users will be fully responsible by their use regarding their own trading vehicles/assets.
The embedded code and ideas within this work are FREELY AND PUBLICLY available on the Web for NON LUCRATIVE ACTIVITIES and must remain as is.
Pine Script code MOD's and adaptations by @XeL_Arjona with special mention in regard of:
Buy (Bull) and Sell (Bear) "Power Balance Algorithm" by: Stocks & Commodities V. 21:10 (68-72): "Bull And Bear Balance Indicator by Vadim Gimelfarb"
Normalisation (Filter) from Karthik Marar's VSA work: karthikmarar.blogspot.mx
Buy to Sell Convergence / Divergence and Volume Pressure Counterforce Histogram Ideas by: @XeL_Arjona
WHAT IS THIS?
The following indicators try to acknowledge in a K-I-S-S approach to the eye (Keep-It-Simple-Stupid), the two most important aspects of nearly every trading vehicle: -- PRICE ACTION IN RELATION BY IT'S VOLUME --
Volume Pressure Histogram: Columns plotted in positive are considered the dominant Volume Force for the given period. All "negative" columns represents the counterforce Vol.Press against the dominant.
Buy to Sell Convergence / Divergence: It's a simple adaptation of the popular "Price Percentage Oscillator" or MACD but taking Buying Pressure against Selling Pressure Averages, so given a Positive oscillator reading (>0) represents Bullish dominant Trend and a Negative reading (<0) a Bearish dominant Trend. Histogram is the diff between RAW Volume Pressures Convergence/Divergence minus Normalised ones (Signal) which helps as a confirmation.
Volume bars are by default plotted from RAW Volume Pressure algorithms, but they can be as well filtered with Karthik Marar's approach against a "Total Volume Average" in favor to clean day to day noise like HFT.
ALL NEW IDEAS OR MODIFICATIONS to these indicators are Welcome in favor to deploy a better and more accurate readings. I will be very glad to be notified at Twitter: @XeL_Arjona
Any important addition to this work MUST REMAIN PUBLIC by means of CreativeCommons CC & TradingView. -- 2015